Nossos serviços estão apresentando instabilidade no momento. Algumas informações podem não estar disponíveis.
Maps for Statistical Purposes
Description
Maps for Statistical Purposes are those conceived for the conduction of IBGE surveys, that is, they are used as cartographic support to field operations. The maps are available for the following geographic strata: municipality, urban areas and enumeration area, according to what is necessary in each census operation.
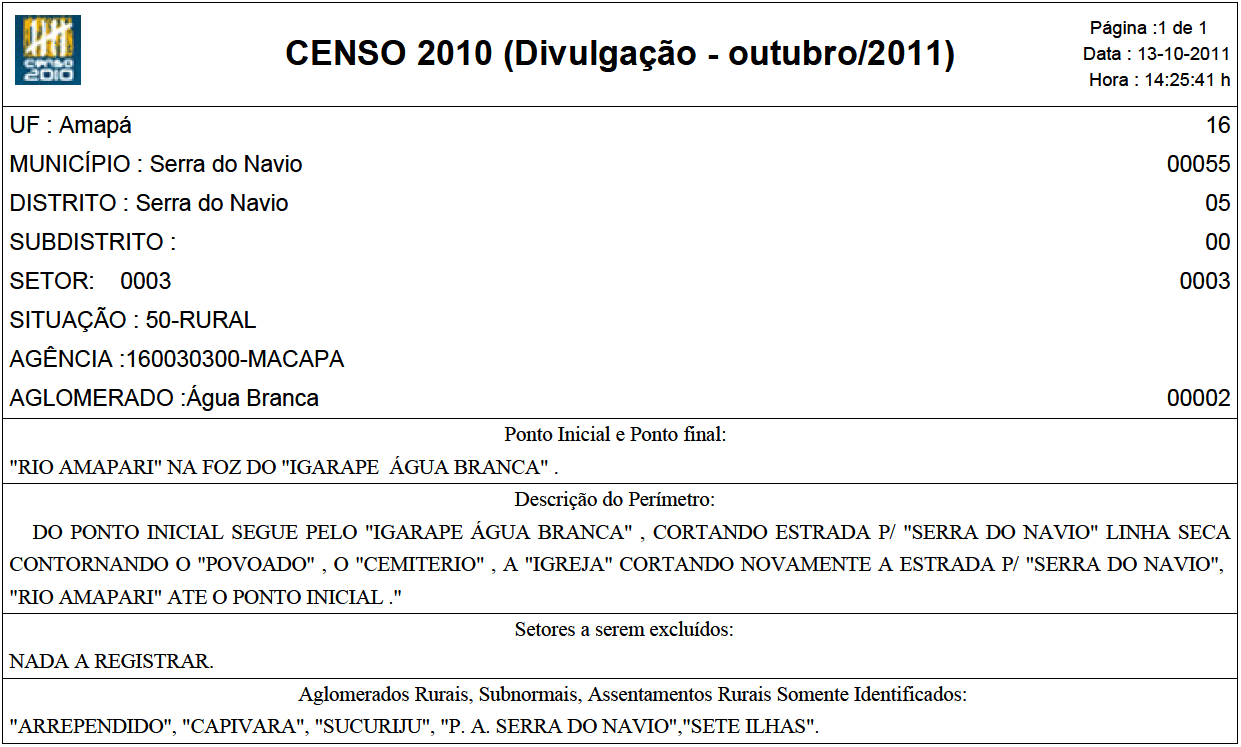
Example of an Enumeration Area Map (in Portuguese)
This is a representation of an intramunicipal Political Administrative Division (with districts and subdistricts), intermunicipal and interstate boundaries, enumeration area borders, planimetric and altimetric elements and hydrography. The area maps also present descriptions of their boundaries, with information on the territory structures that enumeraton area belongs to.
As each census operation takes place the corresponding maps are released. The one currently available are maps used for the Census of Agriculture and Population Count 2007, 2010 Population Census and those relative to population estimates.
About the publication - 2010 Census
The cartographic inputs used in the 2010 Census were Statistical Municipal Maps, Maps for Enumeration Areas and Description of Enumeration Areas.
Statistical Municipal Maps
They represent the municipal territory with the boundaries of districts, subdistricts and enumeration areas; list of streets, drainage and several geographic accidents. Its elaboration was based on topographic charts, satellite images (where available) and the related municipal regulation. In the Census Operation it was useful for enumerators and supervisors to locate accesses to enumeration areas and housing units.
Maps of Enumeration Areas
They represent the enumeration area, that is, the data collection area of an enumerator. The municipal boundaries, districts and subdistricts are in the mp of enumeration area, as well as streets and other points of reference. They are useful for the enumerator to find his area of work in the field, avoiding superposition or omission of housing units interviewed in the enumeration.
Descriptions of Enumeration Areas
The define, in text, the boundaries of enumeration areas. Its length is described from a starting point, and goes clockwise uo to the last point. Both the description and the map of the enumeration area are complementary tools for the field work. Doubts in the interpretation of one of them can be cleared with the help of the other.

The image above also indicates the existence of a rural agglomerate that did not have the enough dimension to be isolated as an enumeration area (51 housing units). These cases are called "identified only".
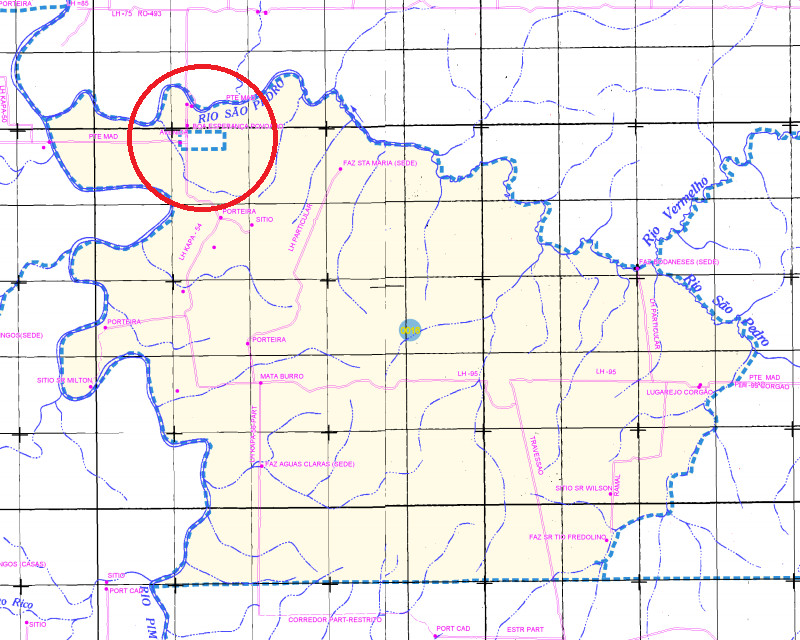
In some cases, there are some census sectors whose boundaries are totally within the area of other sectors, as indicated in the fragments of the map below. The boundaries of enumeration areas, represented by the blue dashed line, indicate that in the northwestern portion there is another enumeration areas, which must not be collected by the enumerator appointed for the dashed line.
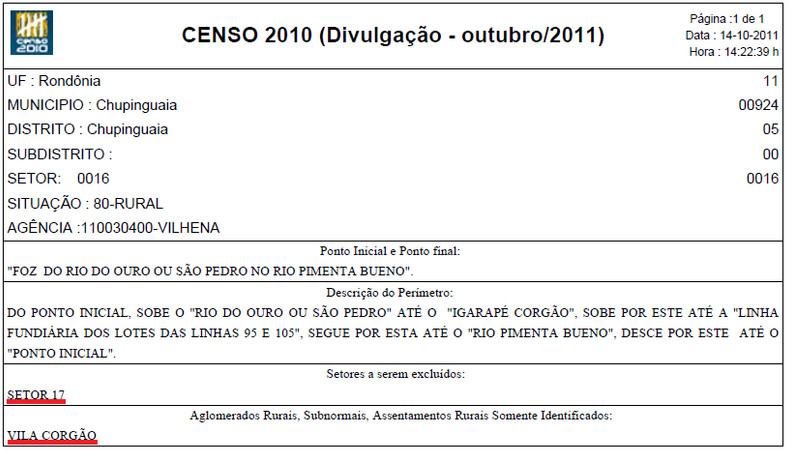
In the description of enumeration areas, these “areas within areas” are indicated by means of the field "Sectors to be excluded", highlighted in the image below.


